“Buy not on optimism, but on arithmetic.” – Benjamin Graham
Understanding Stainless Steel: Market Overview, Pricing, and Key Concepts
In short, stainless steel is an alloy of iron with a maximum carbon content of 2.1%; in fact, the carbon percentage can range from 0.03% to 1.2%. Stainless steel contains a high amount of chromium (a minimum of 10.5%), which improves its corrosion resistance and strength. It should not come as a surprise that, thanks to its properties, stainless steel has been successfully used in various industries. Over time, its applications have grown even wider due to its tremendous versatility. Stainless steel is used in food and catering, chemicals and pharmaceuticals, medical equipment, construction, household appliances, automotive and shipbuilding, and in the energy industry. There are various types of stainless steel, including, but not limited to:
- Austenitic Stainless Steels: This is the most frequently used type of stainless steel, with a share of about 70%. This type has a high chromium content (around 16%) along with some nickel, giving it higher resistance to corrosion.
- Ferritic Stainless Steel: This is the second most common form after austenitic alloys. Unlike austenitic stainless steel, it is magnetic and tends to be less expensive due to its lower chromium and nickel content. This type has better engineering capabilities, but it is not quite as resistant as austenitic stainless steel.
- Duplex Stainless Steel: This type is a mixture of austenitic and ferritic stainless steel, featuring high chromium and low nickel concentrations, high strength, and good weldability. It is widely used in the oil and gas industry.
- Precipitation-Hardening Stainless Steels: This category is durable, very strong (3 to 4 times stronger than austenitic), and corrosion-resistant. This hardening is achieved by adding one or more elements such as aluminum, molybdenum, niobium, titanium, and copper. This type is commonly used in the aerospace, nuclear, and oil industries.
The wide spectrum of applications has led stainless steel to gain market share from “regular” carbon steel in a spectacular fashion. For reference, stainless steel had a market share of only about 2% in the early 2000s, compared to a market share hovering around 5% at present.
Now that we know what stainless steel is, it’s important to understand how it is priced in the global markets. Since stainless steel is a “commodity”, its base price is mainly determined by supply and demand around the globe (more on that later). The base price is what one would pay for a normal steel alloy in the market, but with a surcharge added by producers to offset price increases in raw materials used in stainless steel production, such as nickel, chromium, or molybdenum. This is key because stainless steel producers need a positive dynamic in the base steel price, as well as in the added materials’ price action; otherwise, customers will delay their purchases of stainless steel. Cyclical markets are very primitive in nature, so you can think of it this way: if the price of nickel, for instance, is heavily declining and inventories of stainless steel are satisfactory, customers will wait longer to purchase the product because they assume nickel will drop lower, allowing them to buy at a cheaper price. It’s very nonsensical (after all, prices of commodities can reverse quite quickly), but this is just how cyclical markets work. On the other hand, if nickel prices are very high, everyone would be rushing to buy out the last inventory of stainless steel they can get their hands on.
Now, bearing this in mind, notice that independent distributors handle roughly 20-25% of the stainless steel market volume globally (this figure is from worldstainless.org, but I recall reading somewhere that it’s more in the 40% range). These distributors are often large customers of big producers and focus on delivering from mills to smaller service centers or end-users that cannot directly do business with the big producers. They act exactly as I have described above, and they are responsible for exacerbating the already violent cycles of the industry. If you don’t believe me, let me show you two examples of prominent publicly listed distributors: BE Group and Jacquet Metals.
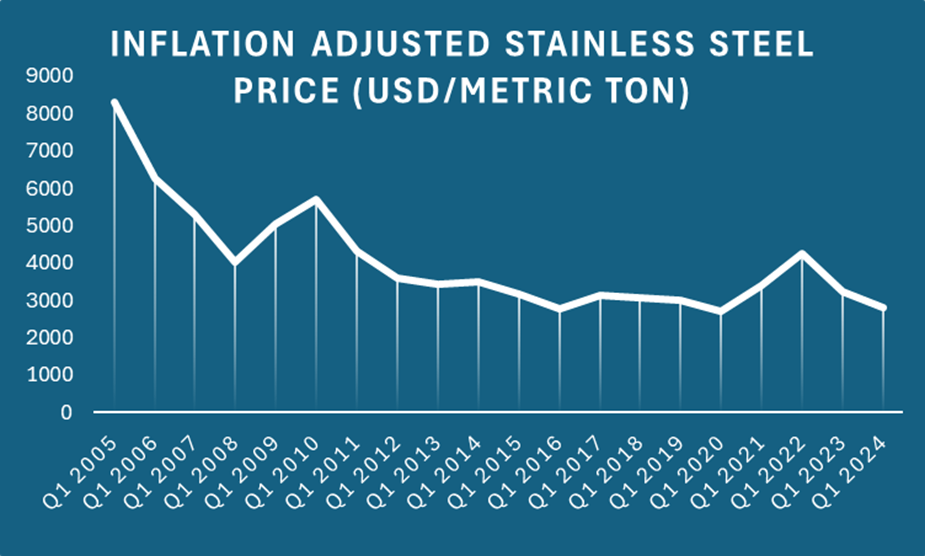
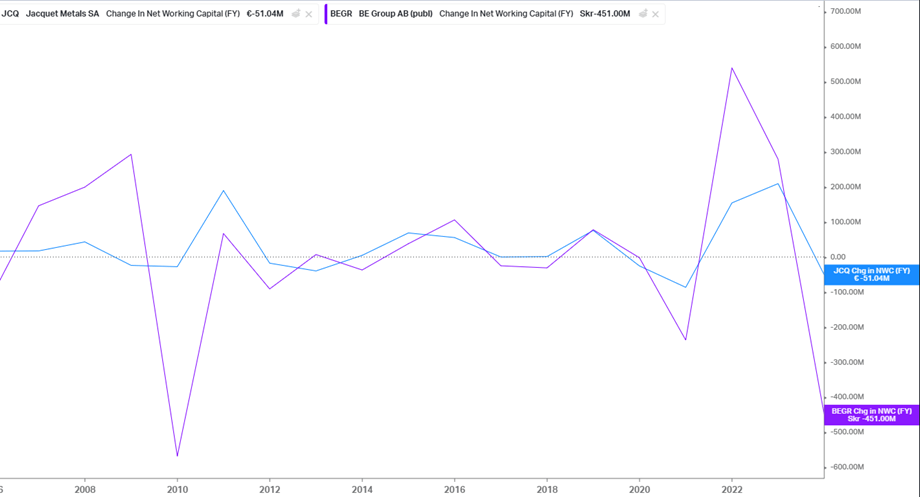
Notice the massive working capital buildup when prices were extremely high (2005-2009 and 2021-2022) and the subsequent violent release of working capital to get rid of higher-priced inventory. As you can see (and we’ll return to that later), not much happened during the 2010s for stainless steel. In fact, on a real basis, we’ve never reached the peaks of 2005 or 2008, and I don’t expect to see such prices in the future.
Another major concept to understand is the apparent consumption of stainless steel. Apparent consumption refers to the total amount of stainless steel available for use within a specific market or region during a given time frame (typically annually). It is calculated as follows: Production + Imports – Exports. Normally, apparent consumption should grow at least in line with GDP. However, that is far from the truth. Take a look at where apparent consumption stands now, using 2014 as a reference year (index=100), noting that 2014 was not a very good year for stainless steel.
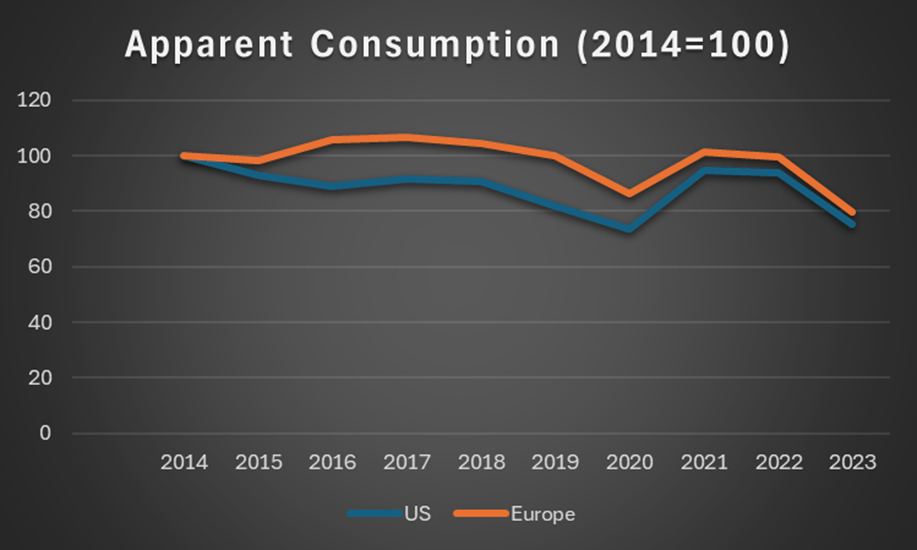
I am not entirely sure about the data on the US, and I suspect apparent consumption is much higher than stated (although it seems credible, because it’s more or less on par with Europe). It’s more difficult to extract information from the annual reports of the major producers since they are very Europe-centric.
However, in Europe, I find it worrying that we are 21% below 2014 levels at least. In the last two years alone, there has been a 22% decrease in apparent consumption. This has seldom happened. For the sake of understanding this report, I’ll tell you about the major Western pure-play producers of stainless steel and their market share. Obviously, there are much bigger producers in Asia, but they’re not all publicly listed, and frankly, I’m not going to invest in Asia if I can find bargains in Europe and the US.
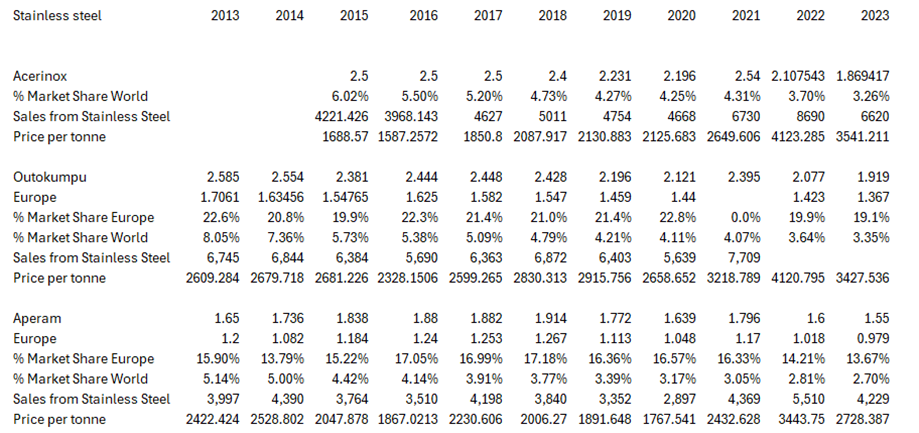
As you can see, Outokumpu is the biggest player in Europe and the second largest in the US. Aperam is a significant player in Europe and an important player in the US, especially with their recent acquisition of Universal Stainless & Alloy Products. The Spanish-based Acerinox is the second largest in Europe and the largest in the US. I’m not 100% sure of the market share numbers but take them as a reference if you wish; it’s not of major importance since they’ve all lost market share to China on the world stage while keeping their market share fairly stable among themselves.
Chinese Overcapacity Screwing the Party for Everyone
Before entering the topic, some context: To support its economic boom in the 1990s and early 2000s, the Chinese Communist Party (CCP) prioritized sectors that were strategically important for economic growth and aligned with its vision for “common prosperity.” The steel industry was a primary focus, as the CCP sought to build a strong infrastructure and industrial base. Regarding steel production—and specifically stainless steel—China held a 2% share of the global market in 2000. By 2015, however, this share had skyrocketed to 52%, an achievement unprecedented in history. From 2000 to 2007, China’s economy was booming, consuming all excess capacity it produced. This decade was remarkable for steel demand, with general steel and especially stainless steel demand growing at 7% per annum due to the property sector’s rapid global expansion, although this came to an abrupt halt with the subprime crisis.
The Global Financial Crisis (GFC) did not impact China as deeply as it did Western economies, allowing the growth trajectory to continue a bit longer. By 2011/2012, stainless steel producers—after experiencing years of extraordinary profits—were beginning to feel the strain. However, there was not yet significant talk of Chinese overcapacity in stainless steel (or steel in general), as China continued to consume every ton of steel it produced. Mentions of Chinese overcapacity began around 2014. By then, China’s GDP growth had slowed to around 7.5% from the double-digit figures of the early 2000s. In 2014, China’s GDP grew at 7.43%, missing CCP targets and sparking panic across global commodity markets, given that China had been the primary consumer of almost all commodities during its economic miracle. This slowdown coincided with a significant drop in almost every commodity in 2014/2015.
With debt-fueled infrastructure investments beginning to decline, China found itself with substantial excess capacity in stainless steel, which it then offloaded into global markets. To maintain acceptable factory utilization rates, the Chinese government granted benefits to stainless steel producers who managed to export their excess capacity. Suddenly, European producers began to argue that China should not be granted Market Economy Status by the EU and pushed for the application of trade barriers. Starting in 2014, no major stainless steel company’s annual report lacked mention of Chinese overcapacity as a threat to profitability. European producers lobbied for strict anti-dumping measures, which they partially secured. In 2016, China committed to addressing overcapacity by closing inefficient and polluting facilities, ceasing grants for new factories, and halting subsidies that allowed for dumping into global markets. However, few of these measures have been fully implemented. To circumvent EU anti-dumping measures, Chinese companies established new steel and stainless steel production plants in emerging Southeast Asian markets. A prominent example is Indonesia, where Tsingshan built large facilities, contributing to a severe oversupply in Southeast Asia. This oversupply drove the remaining European producers in Asia to retreat, as they simply could not compete.
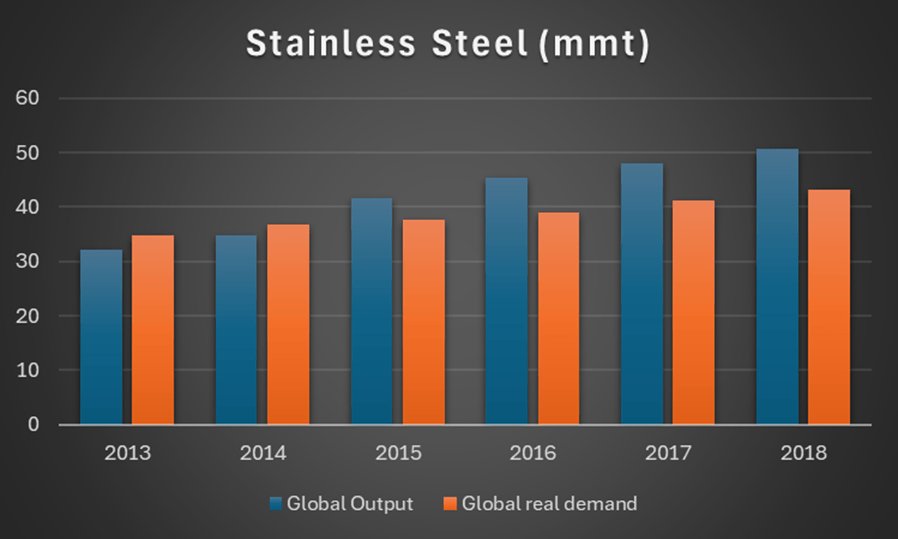
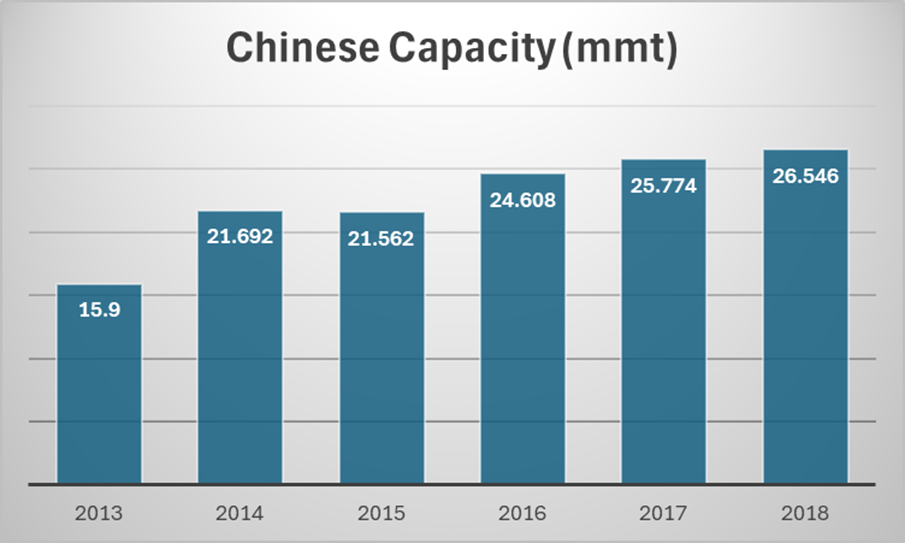
For illustration, reviewing global stainless steel capacity against demand from 2013 to 2018—as well as China’s specific capacity—shows a significant mismatch (data sourced from the annual reports of the top three producers and supplemented by World Steel Organization reports; these figures may not be fully accurate but are the best available freely). This period was indeed a lost decade for stainless steel profitability, as producers worldwide (except for China) faced tough market conditions and operated under suboptimal production circumstances.
Things began to improve somewhat from 2019. The COVID-19 pandemic ushered in a new trend of regionalization, highlighting the fragility of global supply chains and boosting interest in near-shoring. For stainless steel and steel in general, since the early 2000s, all incremental production has been in China and supported by its incentives for critical sectors not only domestically but also in countries along the Belt and Road, which benefited from substantial Chinese infrastructure investment. Considering this context, it is remarkable that European plants survived the past decade despite low prices and fierce competition; they were forced to shut down inefficient plants, reduce output, and boost productivity.
In 2021, low inventories, supply chain disruptions, and optimism spurred by mass vaccination caused demand for stainless steel to surge. China, struggling under its Zero-COVID policy, could not supply world markets with ease, causing prices to skyrocket. Supply chains needed to restock, and with limited availability, prices rose. Unfortunately, distributors and false rumors that China would be unable to meet future demand prolonged the restocking process for nearly two years. By 2023, prices began to fall again as inventories were fully replenished, with Chinese factories ramping up production to supply the European market during this restocking phase. Distributors and consumers ended 2023 with excess inventory. European producers cut production to levels lower than during the GFC, with Acerinox’s CEO calling this “the worst time in his long career in the steel market.” In 2024, the destocking process is nearing completion but may continue for several more months or even a year.
Nonetheless, I believe we are entering a new paradigm. We are likely moving toward a hybrid economic model of globalized trade combined with regionalization, which should benefit European steel companies and provide some relief after the flood of competition from China and Indonesia over the past decade. Additionally, China appears to have shifted its focus from strict growth to prioritizing environmental improvements and reducing inequality. Chinese production seems to have stabilized at around 35 million metric tons per year, and it seems reasonable to anticipate a reduction or stagnation in their capacity expansion, especially as the property sector struggles and older facilities are gradually phased out. No new major suppliers of stainless steel are expected to emerge in the near future—not even India, whose capacity has remained stable at about 3.5 million metric tons per year over the past decade. The macroeconomic fundamentals suggest that stainless steel may be poised for a recovery, providing a better pricing environment where European producers can finally leverage their efficiency.
Outokumpu Oyj: Market Leader, Now Trading at a Discount
As much as I like analyzing the macro setup of all my investments, I never make an investment solely relying on macro. If I don’t find bargains, I’ll gladly skip even the best macro setup. Fortunately for me, I did find a company that matched my criteria for a bargain.
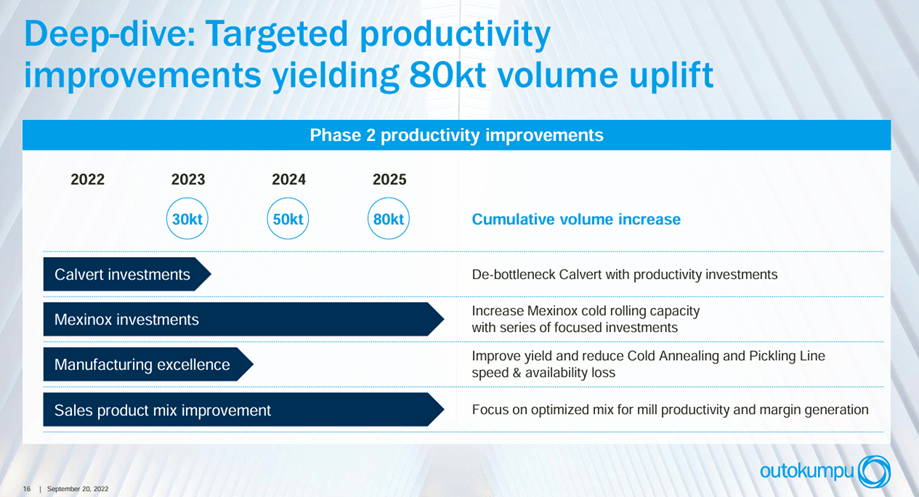
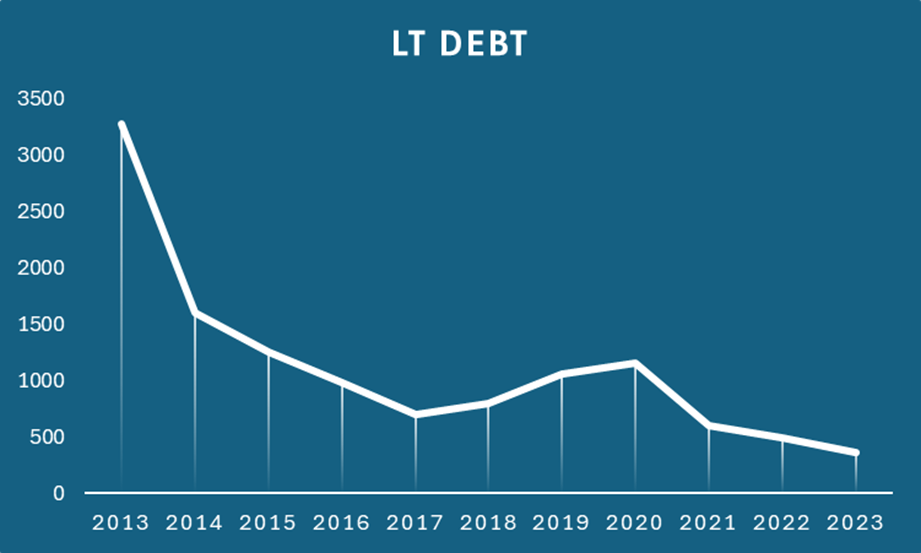
Outokumpu became one of the global leaders in stainless steel after the business combination with Inoxum, the stainless steel division of Thyssenkrupp, in 2012. As I said previously, due to a horrendous pricing environment through the decade of the 2010s, the company went through restructuring multiple times and had to divest some European assets, such as its VDM division (now part of Acerinox) and the Terni Mill in Italy. The company also divested Mexican and Chinese assets. It closed down a melt shop it had in Bochum, along with other smaller non-core assets. The company has been reducing debt massively, and finally, after the huge run-up in stainless steel prices in 2022, they were debt-free. This is very good, as the company can endure cyclical downturns with more ease than competitors. In 2020, the company announced a new strategy consisting of 3 Phases: Phase 1 revolves around de-risking the company through margin improvement, cash flow management, and deleveraging the balance sheet (this has been done); Phase 2 aims at strengthening the core of the business, which should be completed by next year; and Phase 3 revolves around expanding in the U.S., remaining competitive in the European market, and better integrating the supply chain. Capital allocation has been good over the last years; dividends have rewarded shareholders, and buybacks have been executed. Over the last three years, more than €450M has been returned to shareholders, which is around 30% of the current market cap. Now, all this restructuring has left the company with very strong core assets, which we will analyze in the next paragraph.
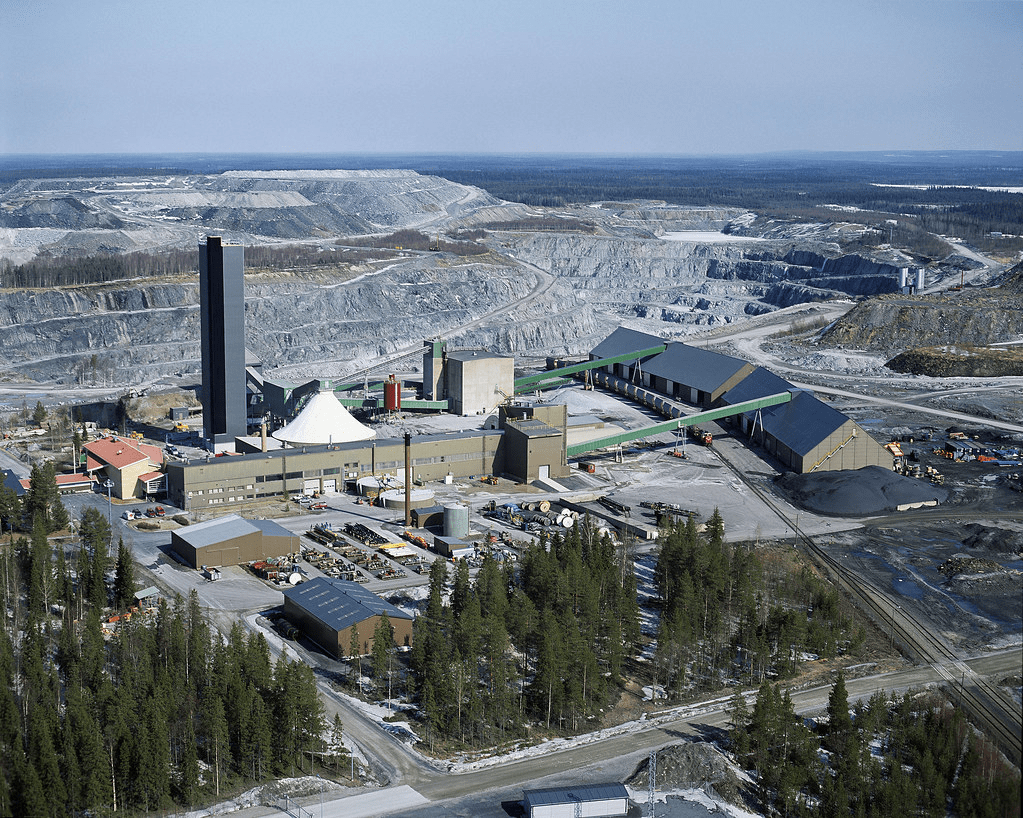
The company has four main facilities around the world: the Kemi mine and Tornio stainless steel mill in Finland, the Krefeld stainless steel mill in Germany, and the Calvert stainless steel mill in the U.S.
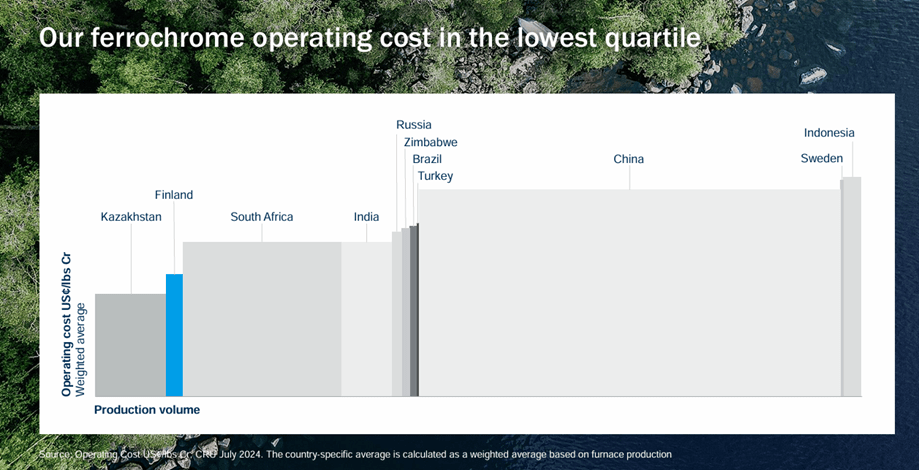
The Kemi mine is by far the most interesting asset. It is the largest ferrochrome producer in the Western world, and as you know, ferrochrome is absolutely critical for making stainless steel. Kemi is the only ferrochrome mine within the EU and is set to become the world’s first carbon-neutral mine by 2025. With recent investments, the mine’s life has been extended to 2050, which is significant. This extension allows the company to benefit from a high level of integration and a secure supply of such a crucial mineral. It’s worth noting that most ferrochrome in the EU is imported from South Africa, where production capacity is being reduced. Kemi’s production accounts for 3% of global ferrochrome output and has one of the lowest cash costs in the industry.
Thirty kilometers from the Kemi mine is the Tornio area, which includes a steel melting shop, a hot rolling mill, and a cold rolling mill. The Kemi-Tornio integration provides the company with a unique competitive advantage in the industry by lowering internal logistics costs and creating synergies in personnel and administrative expenses. In fact, the Tornio plant uses over 90% recycled scrap steel.
The Calvert stainless steel mill has historically weighed on profitability, but it has performed relatively well since 2020 and is expected to improve further as Outokumpu plans to increase vertical integration in the U.S. This facility has focused on growing key customer relationships and becoming a reliable supplier for large distributors with high customer service expectations. This shift has been a learning experience for the company, as European distributors tend to be smaller with less bargaining power. The company has adapted well, and I expect profitability to improve relative to historical levels. Additionally, Outokumpu has worked on debottlenecking operations to enhance productivity.
The company indeed has some of the best core assets in Europe and strong growth potential in the U.S., so it would be reasonable to expect it to trade at a premium to peers. However, that’s not the case.
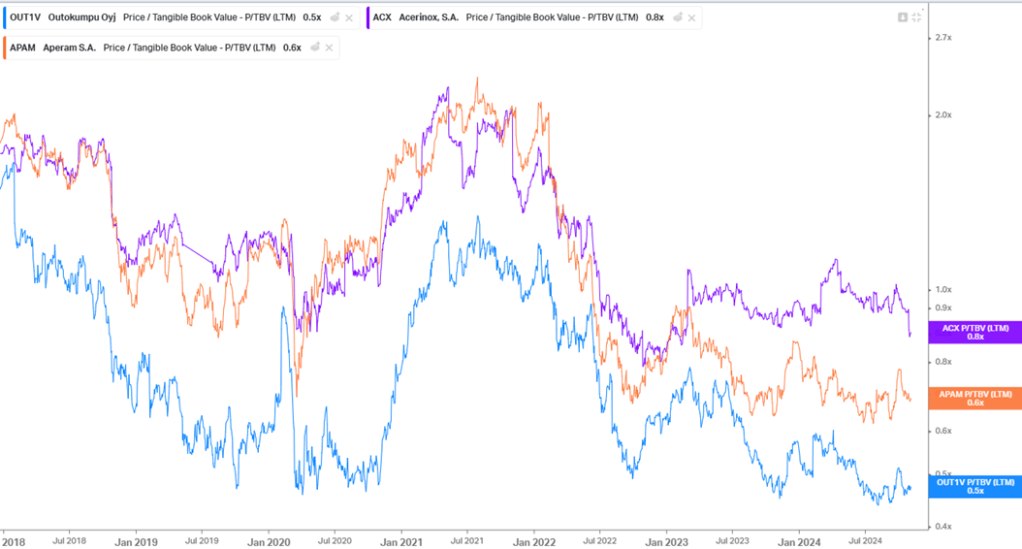
The company currently trades at a discount to peers and at about half of its historical Price/Tangible Book Value (P/TBV) ratio. But what does this tangible book value actually consist of?
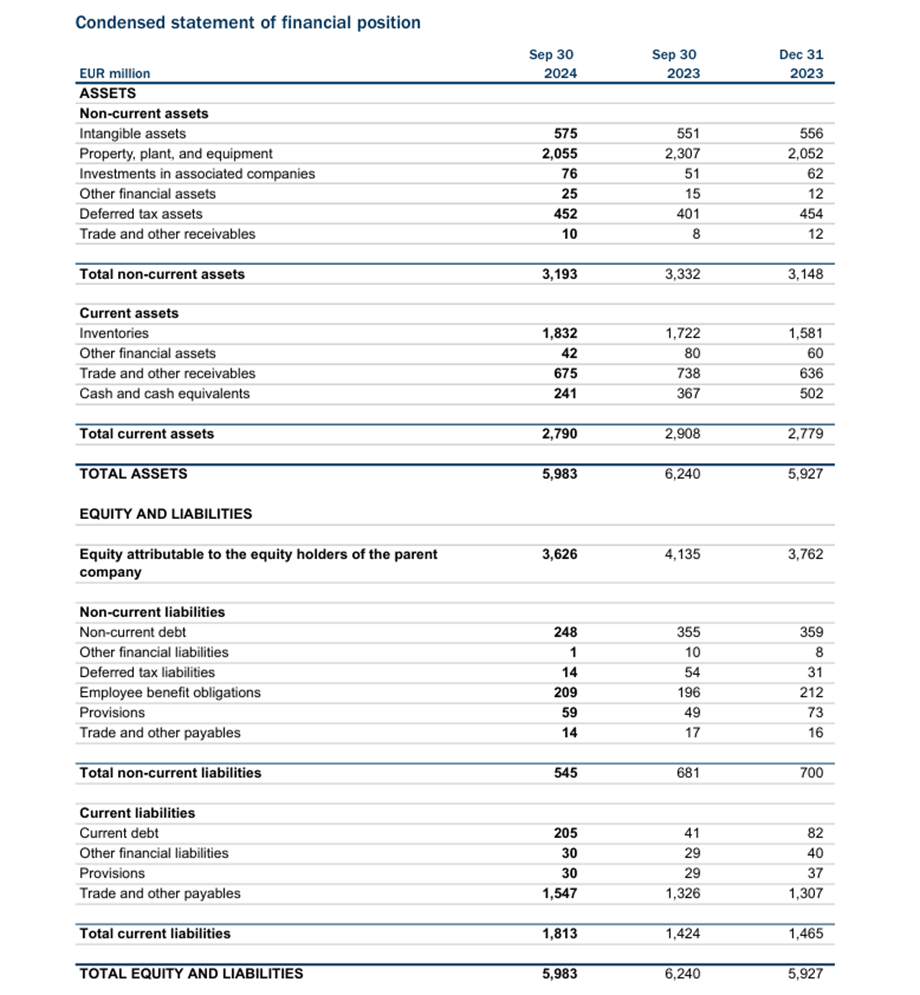
First, I believe that the reproduction cost is significantly higher than the stated Property, Plant, and Equipment (PP&E) value. For example, the Kemi mine alone could conservatively be worth around one-third of the stated book value of PP&E. However, let’s set that aside for now. Tangible book value stands at approximately €3.05 billion, meaning a return to historical Price/Tangible Book Value (P/TBV) levels could yield a twofold increase in value.
Additionally, with net debt at €212 million, the company’s leverage is modest—around 0.5x normalized EBITDA—showing that Outokumpu’s balance sheet is in very strong shape.
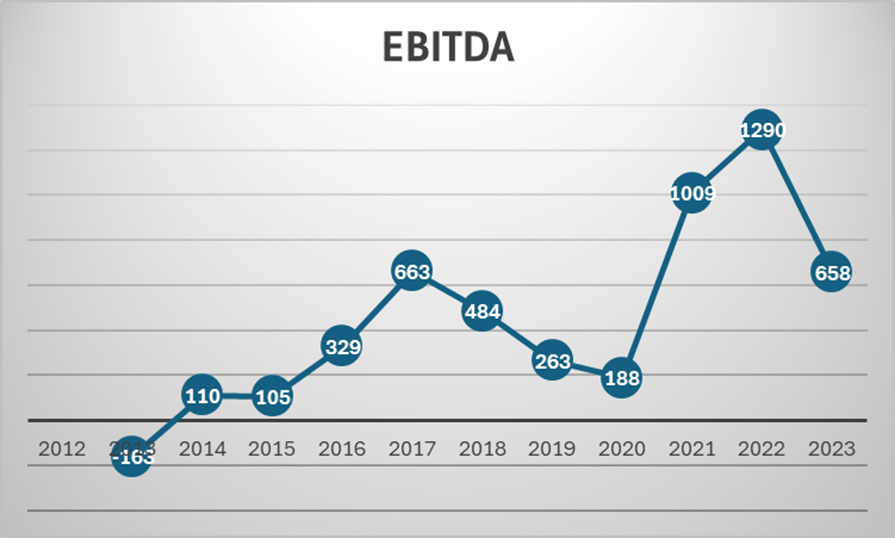
Assuming a stainless steel price of $3,200 per metric ton—reasonable given current macro conditions and the trend toward regionalization—and a production level of 2 million metric tons (below historical averages), projected revenues would be around €6.744 billion. With an operating margin of 3.1%, which aligns with the median of the past 12 years, expected EBITDA would be approximately €486 million. This estimate also aligns with the company’s medium-term guidance.
At this level of EBITDA, Outokumpu’s enterprise value (EV) to EBITDA ratio would be around 3.5x. For a major player like Outokumpu, the largest stainless steel producer in Europe, this is notably low—less than half its historical valuation, even as fundamentals have improved significantly.
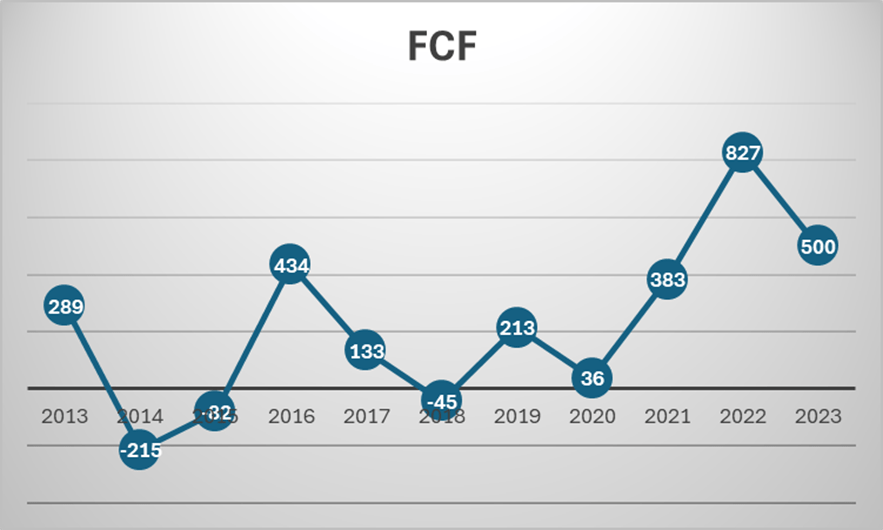
Assuming financial expenses aligned with Outokumpu’s current debt level, some working capital release (considering that working capital is currently at historical highs), depreciation and amortization (D&A) consistent with historical levels, and sustaining CapEx of about €160 million, the normalized Free Cash Flow (FCF) comes out to approximately €381 million.
This results in a Price/Free Cash Flow (P/FCF) ratio of 3.67x, which is extremely attractive for a major player, especially the largest stainless steel producer in Europe. Given the company’s improved balance sheet, low valuation, and strong cash generation potential, this certainly looks like a bargain.
State of the market as of Q3 2024
Currently, the industry is adjusting production downward due to low stainless steel prices. So far this year, Outokumpu has slashed production by 6% and Acerinox by 7%. Aperam, on the other hand, increased shipments by 7%, mainly because it is more exposed to the American and South American markets, which have not been hit as hard as Europe.
Year-to-date, the company has delivered €190 million in Adjusted EBITDA (excluding the €60 million impact on EBITDA caused by a strike in Finland during H1 2024) and recorded a negative free cash flow (FCF) of around €40 million. This is not surprising given the challenging environment. The company does not anticipate any improvements in Q4 2024.
The European market remains very weak, but destocking will eventually draw down inventories. Imports in Europe are currently at about 18%, below the historical average, while in the U.S. they stand at 27%. However, the U.S. market is also showing signs of weakness, particularly this quarter.
I believe the setup is favorable for a rebound in stainless steel prices going forward, though it will undoubtedly require time and patience.
Gonçalo
