
“Bull markets are born on pessimism, grown on skepticism, mature on optimism and die on euphoria. The time of maximum pessimism is the best time to buy, and the time of maximum optimism is the best time to sell.”
-Sir John Templeton
History, Notions & Fundamentals
Platinum Group Metals, commonly known as PGMs, comprise six noble and precious metallic elements grouped together in the periodic table: ruthenium, rhodium, palladium, osmium, iridium, and platinum. Typically, these metals are found together in mineral deposits. PGMs are primarily utilized in the automotive industry, particularly as auto catalysts in both diesel and gasoline vehicles since the 1970s.
Platinum boasts the longest track record among PGMs as an auto catalyst. However, in the 1990s, the low price of palladium (attributed to potential market flooding by Russia) prompted the platinum for palladium substitution in gasoline auto catalysts, despite requiring twice the amount of palladium for the same effect. During this period, palladium, seen as having little value or application, accumulated unintentionally from Russian nickel-copper mines, fueling the substitution.
Advancements in fuel sulfur content during the early 21st century reduced the necessity for double the amount of palladium in gasoline auto catalysts, making its use in diesel auto catalysts feasible.
Despite platinum and palladium being substitutable at a 1:1 ratio and often mined together, historical trading patterns have shown prolonged periods where one metal trades at a premium to the other. These premiums are influenced by metal availability and market sentiment.
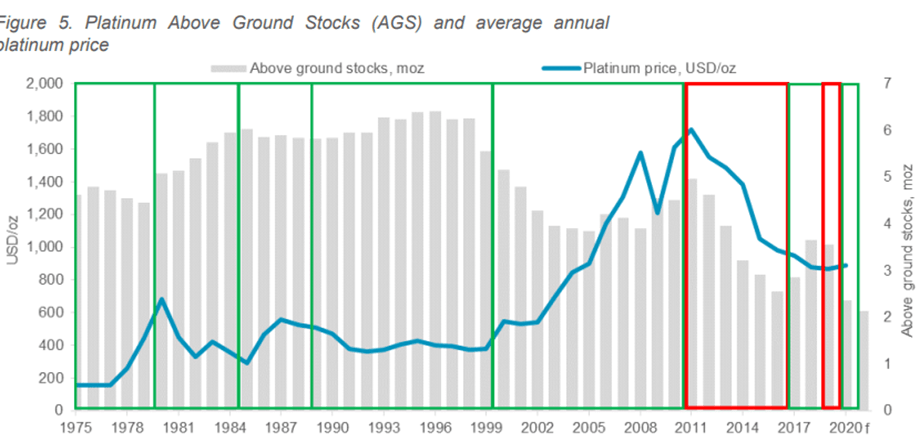
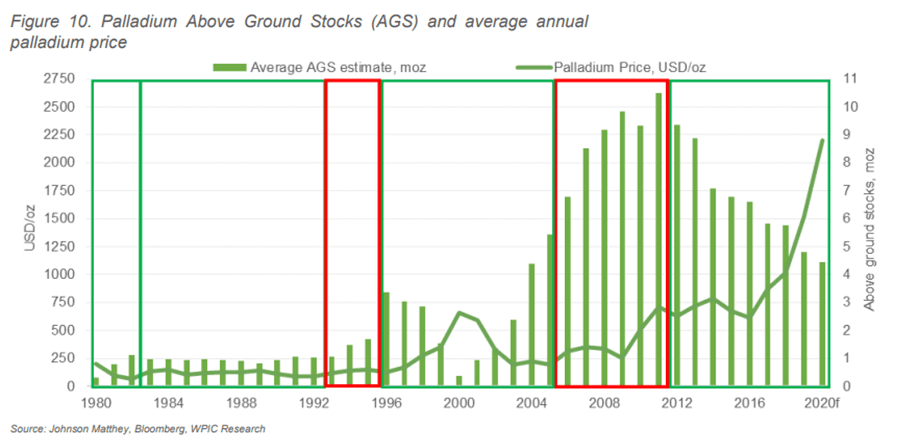
For instance, from 1996 to 2001, palladium traded at a premium to platinum. Conversely, from 2002 to 2017, platinum traded at a premium to palladium as Russia kept the palladium market adequately supplied, while platinum experienced persistent deficits.
Since 2017, palladium has traded at a premium to platinum. Exhaustion of Russian inventories and chronic disinvestment from ETFs in the 2010s led to a surge in palladium prices. This, along with limited palladium availability, incentivized automakers to substitute palladium for platinum once again. Notably, during the pandemic, platinum was the only PGM metal that did not reach an all-time high, with its market appreciation aligning with the overall market. This contrasted with significant increases seen in palladium and rhodium prices during the same period.
Where are we today?
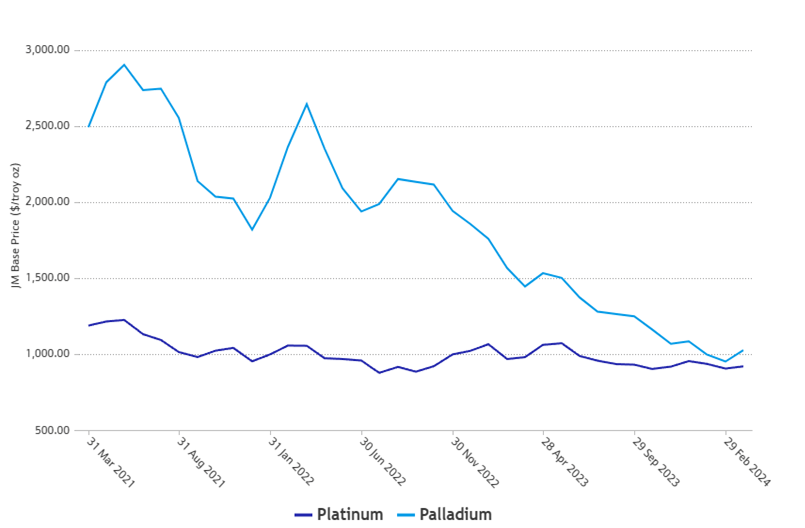
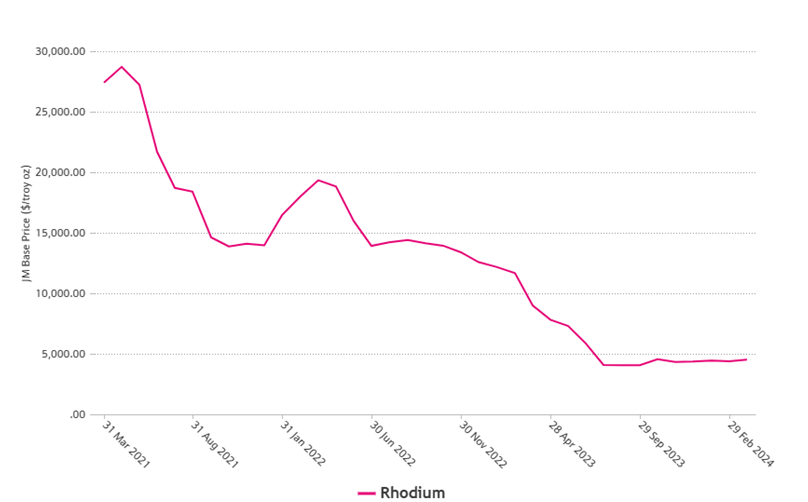
As seen in the charts, major PGMs have taken a beating since their post-pandemic highs. As of March 22, 2024, the Platinum: Palladium Ratio sits around 0.9x. Several factors contribute to this plunge. Firstly, some producers blame the strengthening dollar and recent tightening of monetary policy globally, which tends to push commodity prices down. Secondly, during the pandemic, PGMs experienced a surge in demand fueled by panic buying due to supply chain concerns, leading to significant inventory buildup. Now, customers need to work through these inventories before making new purchases. Moreover, commodity markets are heavily influenced by speculators, with short positions against PGMs, particularly Palladium, and rumors of Russia flooding the market with Palladium to fund its war efforts further adding to the downward pressure on prices.
Despite these factors, negative market sentiment seems to be the primary driver behind the deteriorating short-term prospects of the PGM industry. The rise of Battery Electric Vehicles (BEVs) poses a threat to the demand for PGMs, potentially rendering the industry obsolete as combustion engines are phased out. However, the transition to BEVs is not progressing as smoothly as expected. Most vehicles sold still rely on internal combustion engines and thus require PGM catalysts. Furthermore, there’s growing skepticism in the market about the growth rates of BEVs. Although the premium sector, led by companies like Tesla, has embraced electrification, mass adoption of electric vehicles seems unlikely in the near future. Nonetheless, the market anticipates a respectable 15% Compound Annual Growth Rate (CAGR) for BEVs through 2035, projecting their market share to reach 50.8% of total cars sold by that year.
However, it’s essential to recognize that combustion engines will remain relevant in the near term. In fact, ICE vehicles are expected to incorporate higher PGM loadings due to stricter emission standards. Additionally, PGMs play a significant role in the hydrogen revolution and fuel cell technology, although these applications are currently not factored into pricing due to insufficient evidence of their development. Lastly, like all precious metals, PGMs also attract investment demand, driven by their rarity.
Supply, Demand, Outlook & Thoughts
The majority of PGM supply originates from two politically unstable countries: South Africa and Russia. Together, these nations account for approximately 80% of PGM production worldwide. South Africa dominates the platinum market, holding an 82% market share, while Russia is the primary producer of palladium, commanding a 43% market share. South Africa ranks second in palladium production, with a market share of 34%.
Lately, there has been a surge in pessimism regarding the future prospects of PGMs, fueled by steep declines in prices. However, it’s crucial to delve into the intricacies of supply and demand dynamics to gain a clearer picture of future pricing trends. It’s worth noting that commodity prices, especially in the short term, often reflect a blend of economic factors and sentiment rather than pure supply and demand dynamics.
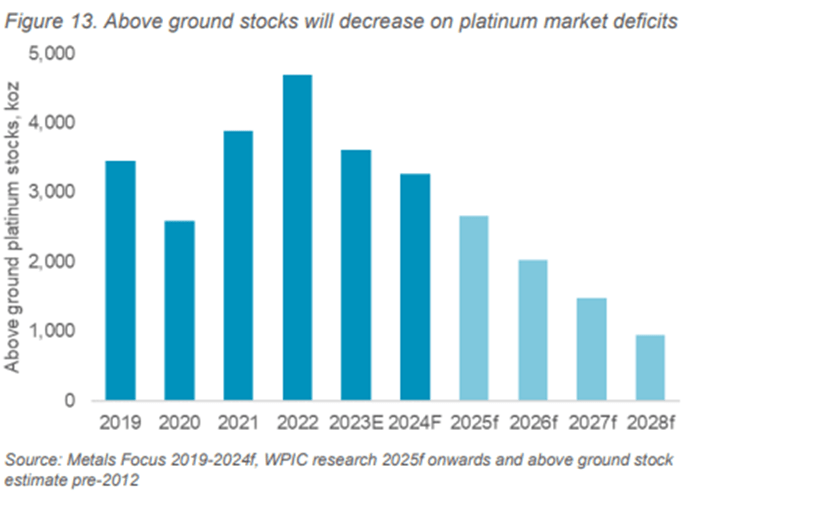
Regarding platinum, significant deficits are anticipated in the coming years. At current basket prices, a substantial portion of mining operations, ranging from 25% to 50%, are operating at a loss, and supply reductions are expected sooner rather than later. For instance, Anglo American is in discussions with labor unions and may potentially lay off up to 3700 individuals, while Sibanye has already trimmed its workforce by 2600 employees and contractors. Implats has reported shedding over 1000 jobs in the latter half of 2023. Given that mining contributes significantly to South Africa’s employment, especially in light of the upcoming 2024 election year, government pressures might compel loss-making production to preserve jobs. However, this would likely only postpone the problem rather than eliminate it. Additionally, Eskom’s unreliable energy supply in South Africa poses a long-term challenge to PGM output. Palladium is expected to face a significant surplus (similar for Rhodium). Russia is anticipated to flood the market with as much Palladium as possible, and Palladium scrap recovery (i.e., recycling of Palladium) will likely strengthen due to the prevalence of palladium in auto catalysts.
Significant underinvestment, coupled with producers trimming Capex, and the absence of major new mines, will undermine supply in the short to medium term. Producers are bracing for depressed prices and a challenging operating environment in the years ahead.
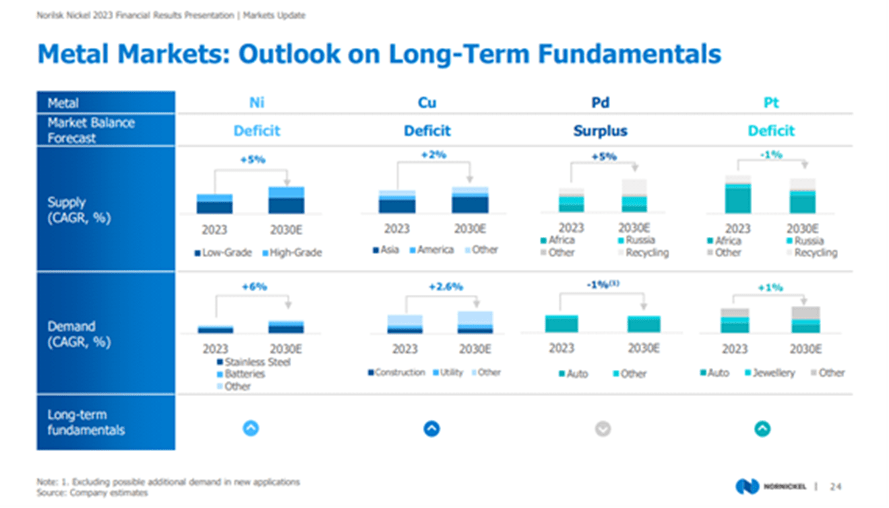
On the demand side, a shift from palladium to platinum is anticipated due to concerns about Russia’s dominance in the Palladium supply chain. However, the recent price parity between the two metals has slowed down substitution significantly. Nevertheless, demand for PGMs is expected to remain sluggish in the coming years. While chip shortages and other supply issues have eased and we returned to pre-pandemic levels in terms of auto production, increased production levels implie that additional demand must come from increased consumer spending, which seems unlikely given the macroeconomic environment. Nonetheless, the majority of vehicles sold in the near term will still rely on internal combustion engines and thus require PGM catalysts, suggesting that writing off PGM miners prematurely could be risky.
In conclusion, if prices remain depressed, prolonged platinum deficits could deplete above-ground stocks and drive prices higher. However, for palladium and rhodium, the upside seems less compelling. Particularly for palladium, while a scenario like 2001 where Russia runs out of palladium to dump is possible, it appears unlikely. Nonetheless, the current price environment overlooks the upside potential (and downside protection) for both metals, presenting an appealing opportunity to enter the market during a period of significant depression.
Sylvania Platinum: Cheap way to bet on PGM Recovery
Before we delve into the analysis, I want to clarify that I have no prior experience investing in commodities or commodity producers, so this marks my initial attempt to ascertain the intrinsic value of a miner.
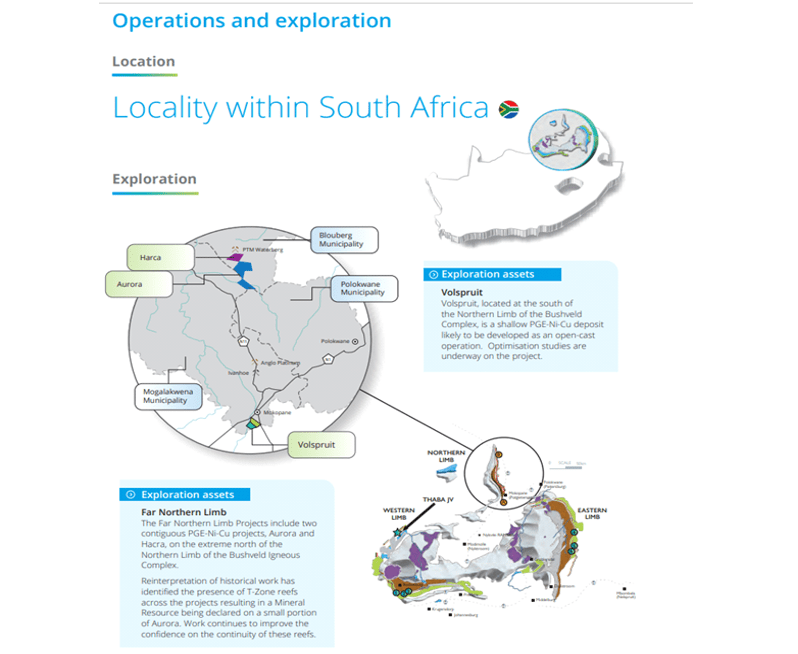
Sylvania operates as a PGM producer situated in South Africa, with its assets located within the Bushveld Igneous Complex. Renowned for harboring some of the most lucrative ore deposits globally, this complex boasts the world’s largest reserves of platinum-group metals (PGMs) or platinum group elements (PGEs), including platinum, palladium, osmium, iridium, rhodium, and ruthenium, alongside substantial quantities of iron, tin, chromium, titanium, and vanadium.
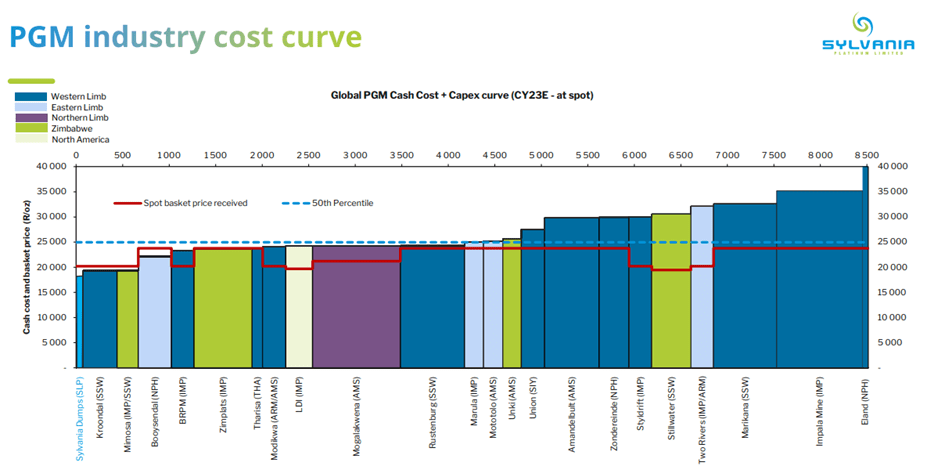
The company categorizes its assets into two main types: operational and exploration assets. It’s worth noting that, despite being a small company contributing approximately 1% to global PGM production, Sylvania stands out as the lowest-cost producer within the industry. The company boasts Cash Costs averaging around $830 per basket, significantly lower than those of its larger competitors. This occurs because Sylvania’s assets primarily consist of Dump Operations, which necessitate less intensive processes for extracting PGM material.

(Note: I calculate Cash Costs as Gross Costs divided by PGM production. For diversified miners such as Sibanye, I utilized the Cash Cost figure stated in their Annual Reports.)
Below is a description extracted from the annual report delineating the operational and exploration assets:

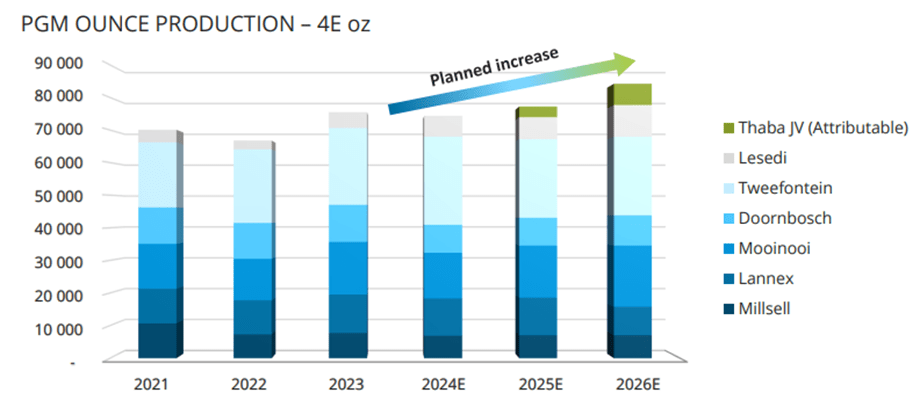
Of particular note is the Thaba joint venture, which is geared towards ramping up production levels and establishing itself as a co-producer of chrome concentrates. Through the Thaba JV, the company intends to process chrome tailings sourced from existing historical dumps as well as run-of-mine chrome ore to produce PGM and chromite concentrate. The JV will operate under a Pool and Share model, facilitating the efficient utilization of resources and collaboration between partners. This project is anticipated to deliver a 20% Internal Rate of Return (IRR) and achieve a payback period of 3 years.
Regarding projects, the company adopts a more cautious approach. It primarily focuses on two main exploration assets: The Volspruit Project and the Far Northern Limb.
The Volspruit Project is currently on stand-by due to several factors. The site exhibits low in situ grades, and the development of capital-intensive, in-house smelting, and refining facilities would be necessary. The project does not appear economically viable, particularly in the current depressed price environment. This is attributed to its requirement for high stripping ratios and its modest concentration of valuable minerals. Similar considerations apply to the Far Northern Limb Projects.
The existing Dump Operations currently boast a life-of-mine expectancy of approximately 10 years, although this duration could be extended through further investment. Notably, Project Echo, which incurred a cost of around 170-180 million ZAR, modernized the company’s operations significantly.
Why I am bullish & what I like about the company
When considering exposure to a commodity, there are two primary approaches to consider. The first approach, which I view as less conservative, involves purchasing shares of the highest cost producers and awaiting an increase in the underlying commodity price. Conversely, the second approach entails investing in the lowest cost producers that remain profitable throughout the commodity cycle. While the first approach may yield substantial returns when commodity prices rise, it can also lead to significant losses during downturns since high-cost producers are only profitable when prices are relatively high. On the other hand, the second approach is more conservative, although the potential payoff may not be as remarkable.
To illustrate this concept, let’s examine two hypothetical companies: Company A and Company B. Company A has all-in sustaining costs (AISC) of $1, while Company B has AISC of $0.5. Suppose the commodity price is $1.10 per unit. In this scenario, Company A generates a profit of $0.10, while Company B earns $0.60. Now, let’s assume that commodity prices surge by 50% to $1.65. Following this increase, Company A’s profit jumps to $0.65 (a 550% increase), whereas Company B’s profit rises to $1.15 (a 91.7% increase).
As demonstrated, investing in high-cost producers can result in more significant gains when commodity prices rise. However, as a value investor, I prefer to focus on companies that offer value but are not excessively reliant on fluctuations in commodity prices.
Sylvania falls into the second category described earlier. With Cash Costs of $830 and AISC costs of $870 per basket, it stands out as the lowest cost producer in the PGM market, ensuring profitability across the commodity cycle. Additionally, the company is actively expanding its revenues and increasing production levels through both organic and acquisition-driven growth strategies. Through modernizing existing operations to enhance recovery rates and acquiring new mines such as the Lesedi mine in 2016, as well as through new joint ventures, Sylvania is bolstering its production capacity.
With the current basket price hovering around $1400 per PGM basket, revenues for Sylvania are expected to experience a significant decline, along with profitability. The downward trend in revenues has been pronounced since 2021, coinciding with the decrease in peak prices. Presently, major producers are facing unprofitability, highlighting the potential for prices to rise in the medium term. Sylvania’s low production costs offer clear downside protection in this scenario.
Examining the last major crisis faced by PGM producers, which spanned from the general commodity bear market of 2015 through 2017, provides valuable guidance. Despite the challenging market conditions during that period, Sylvania managed to avoid losses when many other producers incurred losses. Basket prices at that time were approximately $1000, adjusted for inflation to today’s value. However, the current PGM crisis presents a more severe scenario.
Although producers faced losses during the previous crisis, cash costs were comparatively lower.
During the pandemic, a widespread inflationary trend emerged, and as a result of civil unrest in South Africa, wages experienced a significant increase. This aspect of sticky inflation suggests that cash costs are unlikely to decrease substantially. It’s worth noting that some of the elevated wage costs were offset by the depreciation of the South African Rand against the dollar.
At present prices, it’s difficult to envision how major producers, particularly Impala and Anglo American, which collectively contribute approximately 50% of PGM supply, will be able to achieve positive Gross Margins. However, Sylvania is expected to fare relatively well even at current price levels.
Now, let us examine Sylvania’s balance sheet. It’s worth noting that PGM producers are typically well-capitalized, which is an interesting aspect to consider.
As observed, the company does not report any intangibles on its balance sheet. However, it’s worth noting that exploration and evaluation expenditures have been capitalized. To gain clarity on the origin of this value, let’s delve into the corresponding balance sheet note.

This item should represent the value of their unexplored deposits. However, when evaluating the company’s tangible value, it’s important to discount this item as its value is largely “fictitious” and may not accurately reflect the true worth of the company’s (exploration) assets.
Next, you’ll notice that the company holds a significant amount of cash on its balance sheet. This accumulation is a result of generating substantial free cash flow during the PGM “boom era.” However, how the company chooses to allocate this excess cash will be discussed later, particularly in regard to capital allocation strategies.

The company’s debt level is almost negligible. Considering a 50% discount in exploration and evaluation assets, the tangible book value would amount to approximately $205 million. It’s worth noting that around half of this value is held in cash and cash equivalents. Consequently, the company faces a low risk of bankruptcy or an inability to weather an extended period of depressed prices.
In the current scenario, assuming stagnant commodity prices, I estimate that the company would be capable of generating between $8-12 million in normalized free cash flow per year. This would equate to a free cash flow yield ranging between 4-6%, even in a highly depressed scenario, a level of profitability that competitors can only aspire to achieve. However, it’s important to note that the market is currently pricing in the most pessimistic outcome.
It’s a valid question to ask what the company is doing with such a significant cash reserve. Their current dividend policy dictates paying out 40% of free cash flow in any given year. While this policy aligns dividend payouts with profitability, I personally find it too conservative given the company’s cash position. Based on the normalized bearish scenario for free cash flow, this policy would translate to dividend payments ranging between $3.2-4.8 million per year. Consequently, this would result in a dividend yield of 1.6-3.2%. However, I believe the company could potentially afford to distribute a slightly higher dividend, but it’s prudent to maintain a conservative outlook.
It’s worth noting that the company initiated a share buyback program in March 2024. This program allows for a maximum consideration of US $3 million and is set to continue until 30 April 2024. With this allocation, the company has the opportunity to repurchase approximately 4.379 million shares, and in March alone, they’ve already bought back 1.679 million shares, reducing the share count from 263.460514 million to 261.781514 million. Since 2022, the share count has decreased from approximately 272 million to the current 261 million, marking a reduction in share count by 4.2% over two years. Assuming a conservative estimate of a 2% reduction in shares outstanding, this would contribute to your overall returns as well.
Considering the free cash flow yield, dividend yield, and buyback yield, in a depressed price scenario, the total yield would range between 7.6-11.2%. It’s important to highlight that this calculation doesn’t account for any potential upside from higher commodity prices, which could significantly enhance the overall yield and investment returns. Therefore, even in a conservative scenario, the investment opportunity appears quite attractive, and potential upside factors could further bolster its appeal.
Risks, market fears & closing remarks
It’s true that the market appears to be incorporating some of the risks associated with Sylvania, particularly those related to political and geographical factors in South Africa. The country’s socio-economic disparities and judicial uncertainties indeed pose challenges for investment, and ongoing issues with power supply, particularly with Eskom, add further complications. Companies are forced to implement their own generators to mitigate production slowdowns caused by unreliable grid infrastructure.
Given the importance of the mining sector in South Africa, it’s unlikely that the government will take actions that would severely disrupt operations, but the risks remain present. Consequently, it’s reasonable to anticipate that Sylvania will not trade at high multiples, and discounts in valuation are to be expected due to these inherent risks. This cautious approach by the market reflects an acknowledgment of the challenges and uncertainties the company faces, particularly within the context of its operating environment.
The market currently has a bleak outlook on the future of PGMs due to the advent of electrification. However, I am of the opinion that the electrification of the auto industry will progress at a slower pace. Consequently, I believe there are substantial profits to be gained from PGMs until this transition accelerates.
In summary, I believe Sylvania could present a compelling investment opportunity for those who anticipate a longer persistence of internal combustion engines (ICE) than commonly perceived.


2 responses to “PGM Industry: Markets, Miners, Valuation & big opportunities”
Thanks for the excellent piece.
How do you think about the South African risk? How does Sylvania manage the risk of power disruptions and crime at mine sites?
LikeLike
Thank you very much.
South African risk is definitely an important issue, but it’s also bullish because it constrains supply which could lead prices to skyrocket. In regards to power disruptions, they have on site diesel backup generators. In the past there has been social unrest but it has never affected Sylvania’s operations.
In conclusion, there is country related risk, but that’s also the reason why the company is so exceptionally cheap (along with the hate for PGM’s). That’s why position sizing is important. Even as a retail investor you should not make Sylvania occupy a meaningful position in your portfolio, but it depends on your risk appetite.
LikeLike